Dashboard Overview
Dashboard Overview
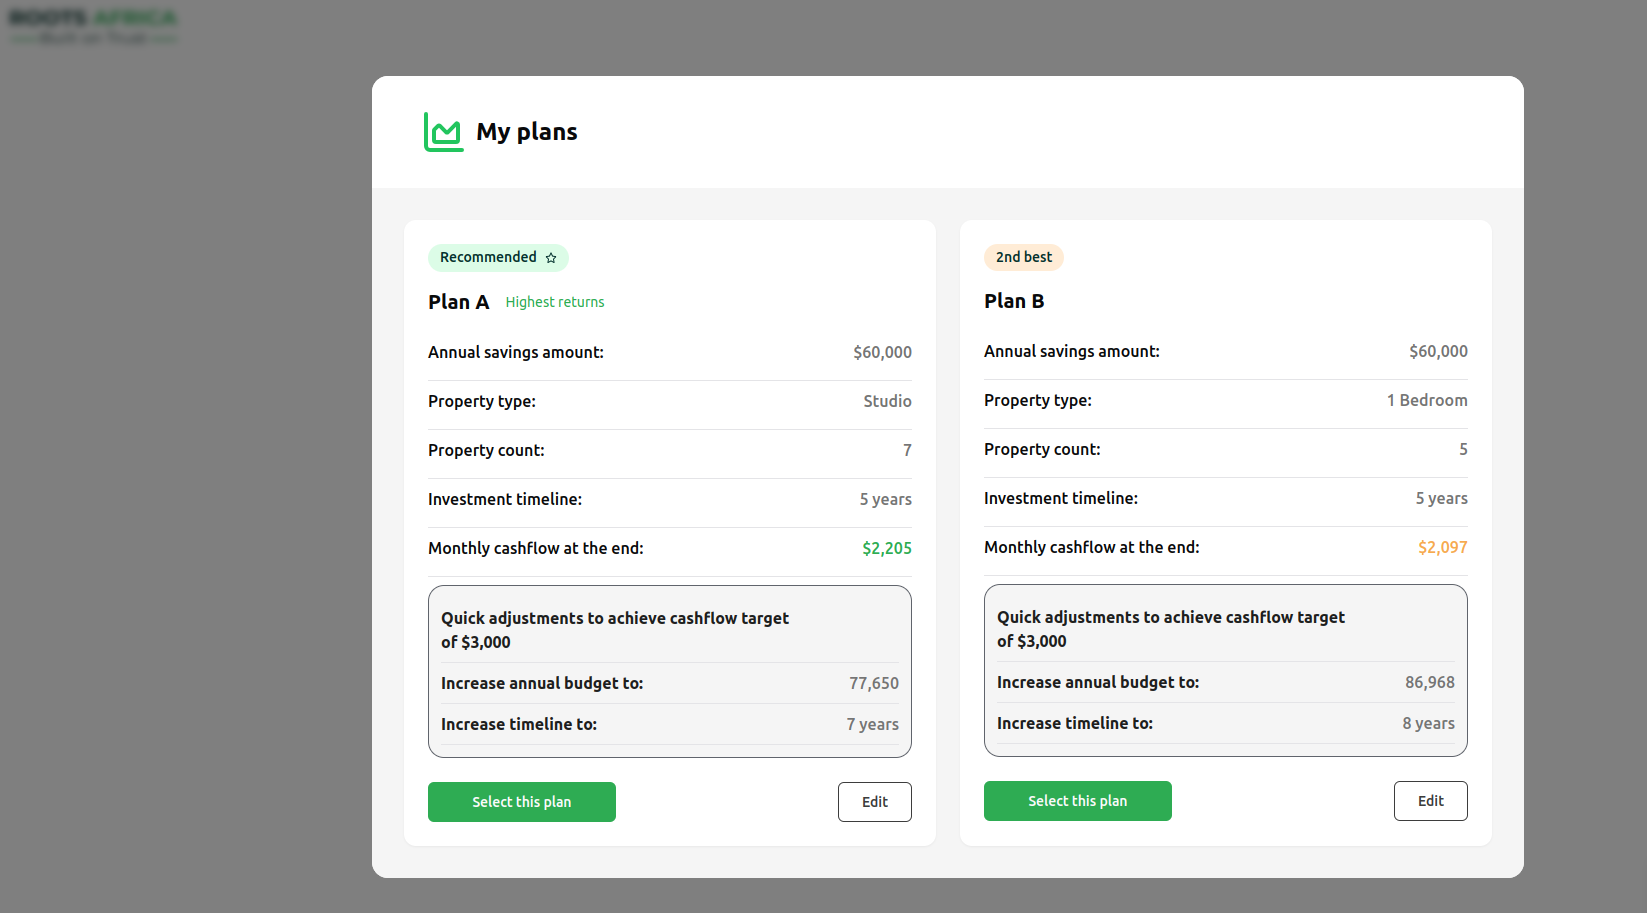
The investment dashboard provides a comprehensive view of your property investment plan and progress. This guide uses example data to demonstrate features and functionality.
📝 Note: The numbers used in this guide are examples:
- Annual savings target: $60,000
- Property type: Studio
- Property count: 5
- Timeline: 5 years
- Monthly cashflow: $2,097 Your actual numbers will reflect your personal investment plan.
Top Section: Key Metrics Cards
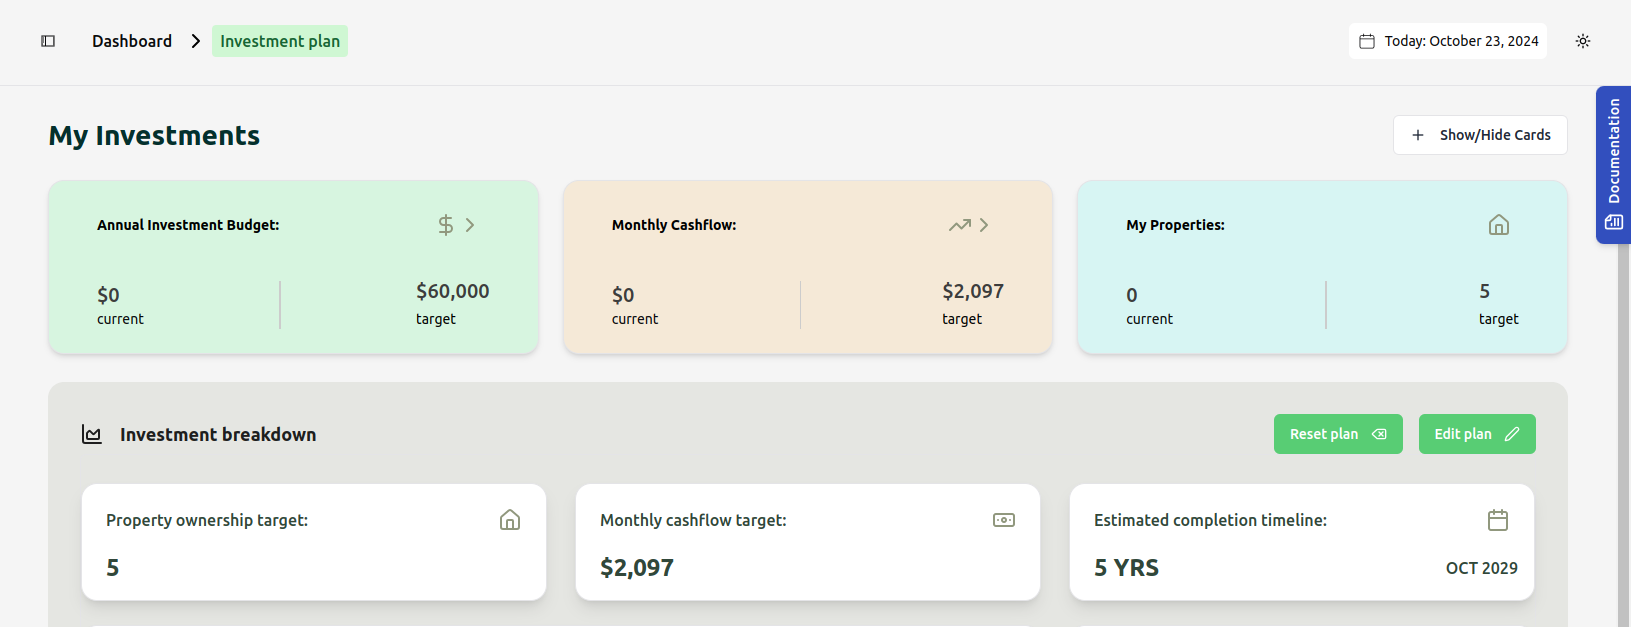
Annual Investment Budget Card
- Current: Shows your current savings (Example: $0)
- Target: Displays your annual savings goal (Example: $60,000)
- Purpose: Track your yearly investment saving progress
- Note: Updates as you log new savings through "Update budget"
Monthly Cashflow Card
- Current: Shows actual monthly rental income (Example: $0)
- Target: Displays projected monthly rental income (Example: $2,097)
- Purpose: Monitor your passive income progress
My Properties Card
- Current: Number of properties currently owned (Example: 0)
- Target: Number of properties planned to acquire (Example: 5)
- Purpose: Track property acquisition progress
Investment Breakdown Section
Key Metrics Display
- Property ownership target: Total properties planned (Example: 5)
- Monthly cashflow target: Expected rental income (Example: $2,097)
- Estimated completion timeline: Total duration (Example: 5 YRS) with end date (Example: OCT 2029)
Control Buttons
- Reset plan: Clears current plan and starts fresh
- Edit plan: Modify existing plan parameters
- Note: Changes require using Edit plan - metrics aren't directly editable
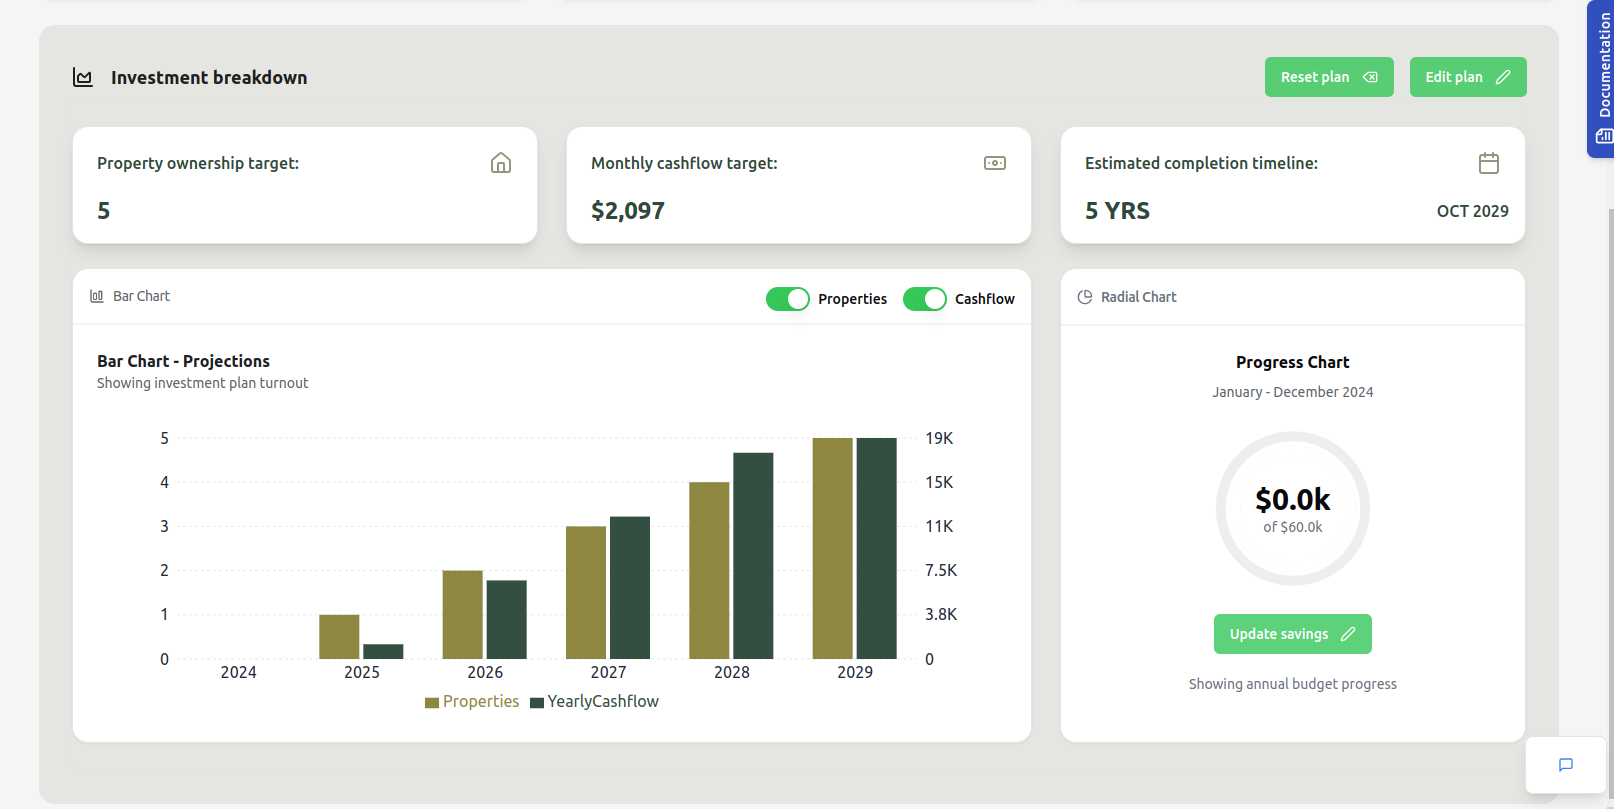
Visual Analytics
Bar Chart - Projections
- Toggle Options:
- Properties: Show property acquisition timeline
- Cashflow: Display projected rental income
- Both can be viewed simultaneously or independently
- X-axis: Years (Example: 2024-2029)
- Y-axis:
- Left: Number of properties (Example: 0-5)
- Right: Cashflow amounts in thousands (Example: $0-19K)
- Interactive Features:
- Hover over bars for detailed values
- Use toggles to customize view
Progress Chart
- Central Display: Current savings vs annual target
- Example Shows: "$0.0k of $60.0k"
- Period: January - December 2024
- Update Button: Log new savings contributions
- Purpose: Track progress toward annual savings goal
Additional Features
Navigation
- Dashboard: Access main overview
- Investment plan: View detailed plan information
- Document Hub: Access related documentation
Tour Guide
- Click "Show Tour" button on the left for interactive guidance
- Recommended for new users or feature updates
Tips for Using the Dashboard
-
Regular Monitoring:
- Check savings progress monthly
- Review property acquisition timeline
- Monitor cashflow projections
-
Updates and Adjustments:
- Use "Update budget" to log contributions
- Review progress against targets
- Use "Edit plan" for major changes
-
Chart Analysis:
- Toggle between Properties and Cashflow for focused analysis
- Hover over chart elements for detailed information
- Use projections to plan future investments
-
Plan Management:
- Save changes when updating
- Use Reset plan with caution - all progress will be cleared
- Regular review of timeline and targets
Getting Help
- Use the tour guide for interactive help
- Access Document Hub for detailed documentation
- Contact support for additional assistance
Important Note: All numbers and projections shown in this guide are examples for illustration purposes. Your actual dashboard will display figures based on your personal investment plan and progress.